To address the complexity of accurately stocking the right mix of items in various sizes, colors, and gender variations—and better understand customer preferences so you more effectively cater to their needs—retailers must address the size curve.
By incorporating size-specific insights into the demand forecasting process, retailers will improve their allocation strategies and enhance overall inventory management.
Understanding Size Curve
A size curve is a graphical representation that illustrates the distribution of customer demand across different sizes within a specific product category. Retailers collect information on the quantity of each size sold within a specific product category over a defined period and create a size curve by analyzing historical sales data and customer purchasing patterns.
Retailers examine the shape, trends, and distribution of the curve. They look for patterns such as the presence of a dominant size or sizes, fluctuations in demand across different sizes, and any notable variations over time or across different customer segments.
Size Curve Varies by Product Category
For example, the size curve for:
- A t-shirt is likely to be different from the size curve for a pair of jeans.
- A product can also vary depending on the target market as well as the geographic location.
- A product for teenagers will be different from that of adults.
- Customers in America will be significantly different from the size curve of customers in Asia.
Size Curve Benefits
Size curve helps retailers by:
- Providing valuable insights into the popularity and demand patterns of various sizes.
- Enabling informed decisions about inventory management and allocation strategies.
- Identifying the most sought-after sizes, anticipating demand fluctuations, and optimizing their inventory levels accordingly.
Demand Forecasting Challenges for Apparel Retailers
Traditional forecasting methods have trouble predicting and capturing fashion trends, consumer preferences, and market dynamics. Traditional methods are also inadequate for considering factors like seasonality, new product introductions, or the impact of marketing and promotional activities. These challenges hit fashion and apparel retailers especially hard.
- Forecasting demand for trendy or fast-fashion items is particularly hard as their short-lived popularity makes it crucial for retailers to quickly capture and respond to these trends.
- These limitations can result in underestimating or overestimating future demand, leading to inefficient allocation of inventory and missed sales opportunities.
- Excessive inventory levels lead to increased holding costs, unnecessary markdowns, and potential losses.
- Retailers may allocate inventory improperly, leading to imbalanced stock levels across different locations, channels, or sizes.
Size Curve Demand Forecasting: A Graphical Representation
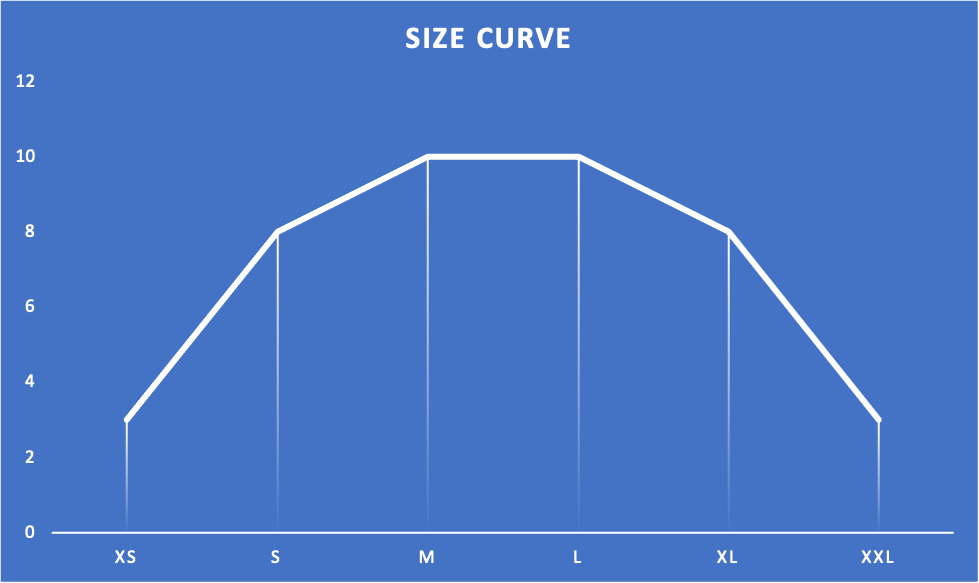
Normal or Bell-Shaped Size Curve
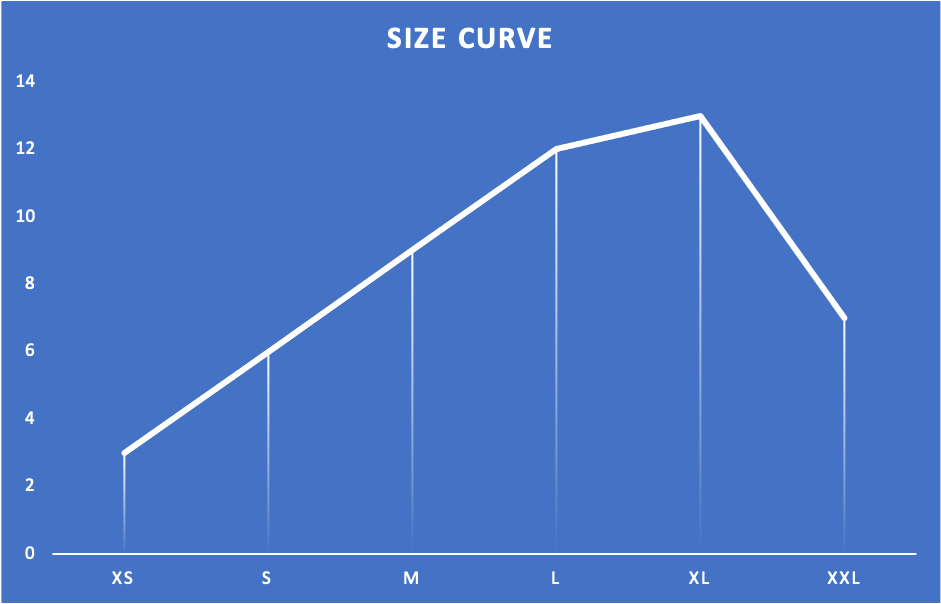
Skewed Size Curve
Size curve analysis creates a graphical representation that illustrates the distribution of demand across different sizes within a specific product category, providing several benefits over traditional demand forecasting methods. These include:
- Improved accuracy for predicting demand by size—Size-specific purchasing patterns enables retailers to predict demand more accurately and stock the right quantities of each size, improving inventory.
- Optimized inventory allocation and replenishment—Insights into demand distribution across different sizes enable retailers to allocate inventory effectively, ensuring that stores and distributors have the appropriate mix of sizes.
- Personalized customer experience—Insights into individual customer preferences and behaviors personalize the shopping experience, offering customers the sizes and products they are more likely to purchase.
- Efficient production planning—Understanding the demand distribution across sizes helps manufacturers optimize their production capacities, streamline the supply chain, and reduce inefficiencies associated with excess or inadequate production.
Size Curve-Based Demand Forecasting: Case Studies
Size curve-based demand forecasting has become standard procedure for most apparel brands.
Nike
Nike forecasts demand for its footwear: Utilizing a size curve, Nike replenishment products (make-to-stock) are forecasted and planned at the style/color level before being disaggregated to a size-level forecast. For example, if size ‘Small’ sells 10 percent of the volume for a given style/variety, the size bend would be set to 10 percent for ‘Small.’ The size curve for a given style or color adds up to 100 percent. A size curve is used to break down style and color stock quantities to make sure target service levels (item fill rates) are met, just like the forecast.
Nike has been able to improve its accuracy in predicting demand by utilizing the size curve, which has aided the company in optimizing inventory allocation and replenishment.
Zara
Zara uses its size curve to forecast demand for clothing, which ensures that it has the right amount of inventory on hand to meet demand.
Implementing Size Curve Demand Forecasting
Data Collection and Analysis
To create an accurate size curve, retailers need to collect and analyze relevant data, such as historical sales data broken down by size, and product category, as well as customer insights, such as size preferences and return rates by size. By analyzing this data, retailers identify trends, size distribution patterns, and variations in demand. This analysis contributes to creating an accurate size curve that reflects customer preferences and demand patterns.
Integrating Size Curve into Existing Demand Forecasting Models
Integrating size curves into existing demand forecasting models enhances the accuracy of forecasts and enables better inventory management.
For instance, a retailer may use machine learning algorithms that consider historical sales data and incorporate size curves as an additional input. By combining traditional forecasting methods with size curve-based insights, the retailer can generate more accurate predictions of demand by size.
This integration enables better production planning, inventory allocation, and replenishment strategies tailored to each size.
Collaboration Between Departments
Implementing size curve-based demand forecasting requires collaboration between different departments within a retail organization. A smart retailer organizes regular cross-functional meetings where merchandising, planning, and operations teams review size curve data, discuss upcoming trends, and collectively make decisions regarding production quantities, inventory levels, and allocation strategies.
- Merchandising teams play a vital role in providing insights into customer preferences, analyzing fashion trends, and understanding size-specific demands. They contribute expertise in assortment planning, pricing, and product positioning based on size curve insights.
- The planning department develops accurate demand forecasts and coordinates inventory management strategies. They incorporate the size curve into their forecasting models, ensuring that the right quantities of each size are ordered and allocated appropriately.
- Operations teams, including production and logistics, need to work closely with merchandising and planning to align production schedules, ensure timely delivery of inventory, and optimize stock levels based on size curve data.
Tools for Size Curve Demand Forecasting
Advanced analytics tools designed specifically for the fashion and apparel industry offer robust capabilities for demand forecasting based on a size curve. Such tools:
- Use machine learning algorithms and data analytics to analyze historical sales data, identify size-specific demand patterns, and generate accurate size curves. The software provides a visual representation of the curve, enabling retailers to easily understand and interpret the distribution of demand across different sizes.
- Provide scenario modeling that enables retailers to simulate different demand scenarios and assess the potential impact on inventory management and allocation strategies.
The benefits to fashion and apparel retailers include:
- Enhanced accuracy—Analysis of size-specific demand patterns yields more accurate demand forecasts, helping improve inventory management, reducing stockouts, and minimizing excess inventory.
- Efficient inventory allocation—Optimization of inventory allocation strategies based on size curve insights ensures the right sizes are available at the right locations.
- Improved decision-making—Real-time insights and scenario modeling capabilities enable retailers to make informed decisions regarding production planning, assortment selection, and pricing strategies.
Take the Next Step
We encourage fashion and apparel retailers to explore size curve-based forecasting methods and adopt an industry-specific advanced analytics toolset.
Download the complete guide today!
Here are the retail industry’s two best products to start with:
- Impact Analytics ForecastSmart™: A demand forecasting engine that uses machine learning to generate highly accurate forecasts for all SKUs at the store, style, or hierarchy level.
- Impact Analytics InventorySmart™: Inventory planning software that ensures the right products get to the right place at the right time.