
 Suryavamsi G
Expert Data Scientist
This is the fourth in a series of blogs pulling back the curtain on Impact Analytics ForecastSmart™ AI-based demand forecasting software.
Unusual Event, Interesting Incident, Erroneous Data or Unwanted Noise?
What is an anomaly?
In the ever-changing world of retail, when we analyze different client datasets, sometimes we detect inconsistent data points or patterns that deviate suddenly and significantly from the norm. These unexpected deviations or occurrences are called anomalies.
We can understand this via an example:
Consider an e-commerce website with a web server that logs data related to incoming requests, such as the number of customer requests per minute.
- Expected Behavior—The incoming requests typically follow a predictable, wavy pattern that varies with the day (weekday or weekend) and time (normal business or peak hours).
- Anomalous Behavior—If the website experiences an unexpected surge in traffic, far beyond what is usual for that day and time, such a spike in incoming requests stands out as an anomaly.
Sometimes these outliers are just noise or erroneous data, and thus not cause for significant concern. Such anomalies may be quickly adjusted or simply deleted to improve the data quality and create a cleaner dataset, which may then be passed to the algorithms to produce more accurate predictions.
Types of Anomalies
Global Outliers
A global outlier is a data point in a specific time period that is located abnormally far from its neighboring points or other values in the time series.
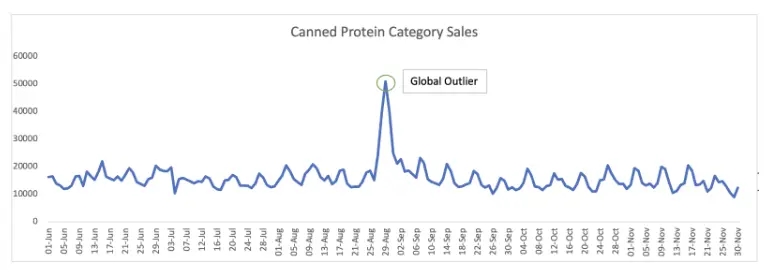 Above is the sales pattern for the Canned Protein category of a leading American warehouse club chain. The global outlier — approximately 51,000 units sold on August 29, 2019 — was due to panic buying immediately after four US states (Florida, Georgia, South Carolina, and North Carolina) declared states of emergence as Hurricane Dorian bore down on them.
Subsequence Outliers
Subsequence outliers are a series of data points in a specific time period whose collective pattern is unusual.
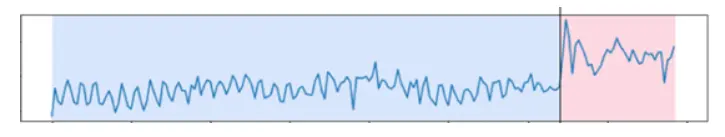 Above is the quantity-sold pattern of a frozen meals item from a leading American warehouse club chain. The collective outlier points, marked in the pink zone, occurred from February 23-29, 2020, due to panic buying brought on by looming store closures in response to the COVID-19 pandemic.
Anomaly Detection Techniques
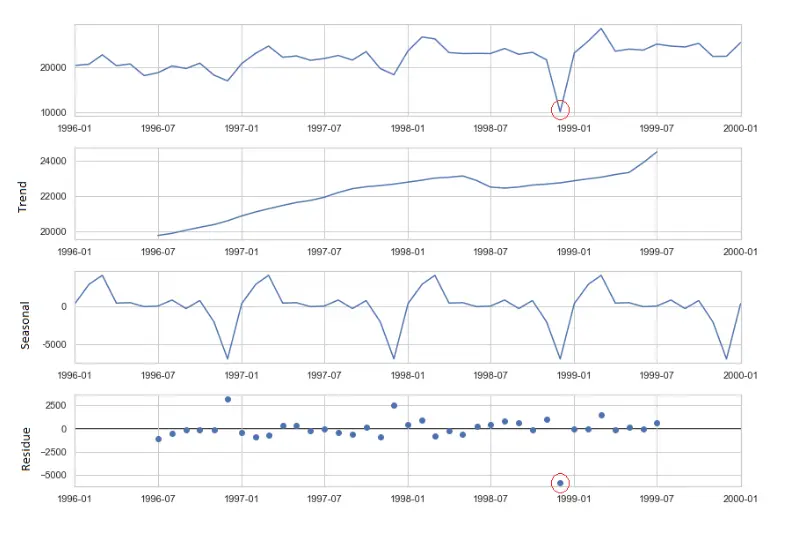
STL Decomposition
STL decomposition refers to seasonal-trend decomposition procedure using LOESS (locally estimated scatterplot smoothing), which gives us three components: seasonal, trend, and residue. We can detect anomalies by analyzing the deviation of the residue component and applying a cutoff or threshold.
 Isolation Forest
Models must be trained to detect outliers in data that return 1 for normal versus -1 for anomaly. Also, the outlier_fraction (a trial-and-error metric) needs to be set to estimate the proportion of outliers in the data, and we need to ensure there is enough data available so the algorithm detects sufficient variance to identify what qualifies as an anomaly. We could add additional features to make the model more sophisticated, but that typically degrades computational performance.
 K-Means
K-Means clusters normal data; data that do not belong to any cluster, or small isolated clusters, may be marked as potential anomalies.
Autoencoders
This is a deep learning-based technique deployed on high-dimensional datasets with complex and nonlinear patterns. We train the model by specifying the number of neurons in input, hidden, and output layers, then use it to predict the anomaly score for each observation in the test data. This can be implemented using frameworks such as TensorFlow or PyTorch or PyOD (a Python module that builds autoencoders internally with few user inputs.)
Z Score
This method uses the standard deviation metric. Points that exceed two or three standard deviations from the mean may be considered anomalies.
Density-Based
Density-based methods estimate the probability distribution of the data and then identify the data points unlikely to have come from that distribution; anomalies are defined as observations of low probability. Below are some useful techniques:
- DBSCAN (Density-Based Spatial Clustering of Applications with Noise) clusters data points based on density (outliers that do not belong to any cluster).
- LOF (Local Outlier Factor) measures the local density around each data point and identifies points with significantly lower densities as anomalies.
Bayesian Online Changepoint Detection (BOCD)
BOCD is an online algorithm that uses Bayesian statistics to model the underlying probability distribution of the data; it detects real-time changes as new data points are added to a time series. This method can detect multiple changes, making it useful in identifying complex anomalies involving multiple events or sources.
Statistical Methods for Anomaly Correction
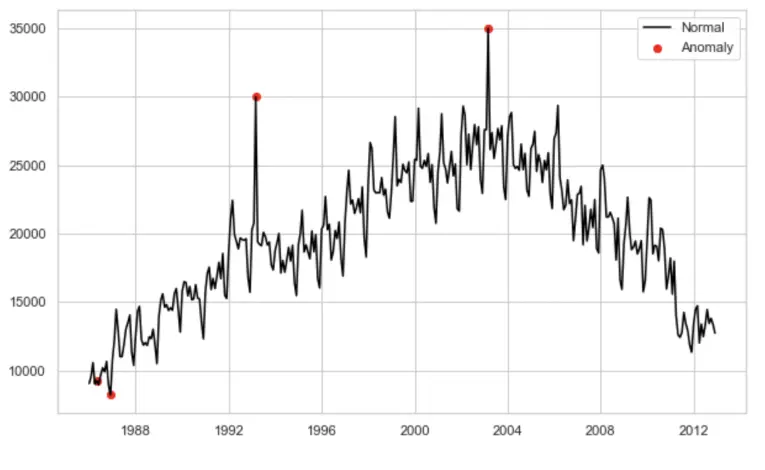
Using mean to smooth out the anomaly
To even out a sudden outlier peak, take an average of the normal data points in the same period from historical years (to follow similar seasonality, etc.), thus adjusting the outlier to match the original distribution.
In the below graph, the anomaly has been adjusted by taking the mean of the Catfish Sales for the same anomalous month but from previous years.
 Winsorization
Replace the extreme values with percentiles; the trimmed minimum and maximum. A typical strategy is to set all outliers to a specified percentile of the data. For example: 90 percent winsorization sets all the data below the 5th percentile to the 5th percentile value and sets all data above the 95th percentile to the 95th percentile value.
Trimming
This removes the extreme values, a certain fraction of the data from both sides. For example: To obtain a 5 percent trimmed mean, take the mean of the 5 – 95 percent range and discard the 5 percent observations on the low and high ends.
Specific Business Use Cases
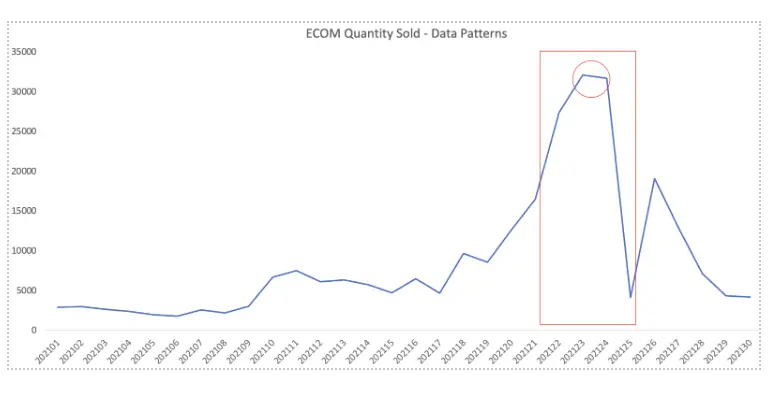 The above graph displays the quantity-sold pattern for an e-commerce channel of an American multinational luxury fashion company. The huge spike (marked in red, ~32,000 units) corresponds to the COVID-19 pandemic when brick-and-mortar stores were closed. It also represents the Cyber Monday effect.
Depending on your goals, you can train the model on the anomaly (to adapt to new patterns) or not (to remove anomalous peaks).
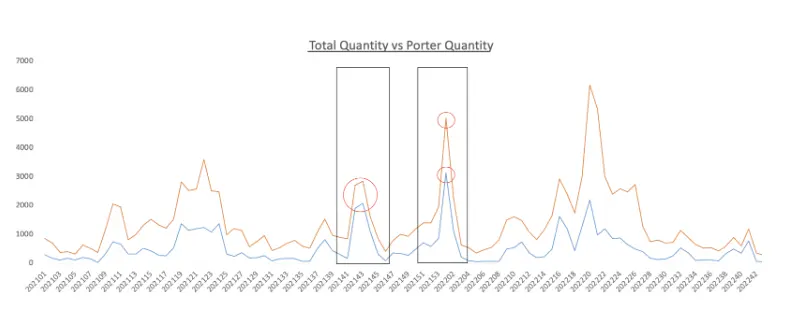 This graph compares the quantity sold from all transactions (orange) versus porter transactions (blue); the porter contribution can vary across different time periods.
For example: The intensity and contribution of porter transactions to total quantity sold is high between 202142 to 202204; in other time windows, it is on the lower side. These spikes are due to “power shopping” by tourists buying products in bulk quantities.
If your objective is to capture normal (nontourist) demand, you’ll identify and remove these anomalous (huge bulk/porter transactions) peaks. The erratic data pattern goes away, and it becomes easier to build an accurate model to make predictions.
Conclusion
Your ability to quickly identify, attribute, and correct anomalies is more important than ever. This requires a robust, automated anomaly detection framework—manual processes are neither fast, scalable, nor accurate—that enables retailers to detect unusual shopping patterns and various discrepancies, and then make informed business decisions.
Take the Next Step
Impact Analytics ForecastSmart™ is an excellent platform for demand forecasting in general and anomaly detection in particular.
Impact Analytics ForecastSmart—Take advantage of advanced machine learning algorithms to generate precise forecasts for every SKU, at any store, style, or hierarchy level, throughout every lifecycle.
Read Automated Style Chaining—The #1 blog in the AI Retail Demand Forecast Technology series
Read Accounting for Rare Events—The #2 blog in the AI Retail Demand Forecast Technology series
Read Cold Start Modeling—The #3 blog in the AI Retail Demand Forecast Technology series